Drawing the inventory
Every diagram netviz produces comes out of one pipeline: a layer decides which
question the picture answers, filters and aggregation decide how much of the
network is in it, and a format decides what the artefact is. This page describes
that pipeline once. netviz render writes a file with
it, netviz watch keeps that file current while you edit,
netviz web serves it, and
netviz path --highlight draws a
traced route over it — all four take the same options and mean the same things by
them.
Contents
- Layers: one inventory, twelve questions
physicalandl1: the cabling record and the networkl2: the same graph, annotated with VLANsl3: prefixes and who is addressed in themipam: the address plan, and where the room isoverlay: tunnels and what runs inside whatrouting: sessions, adjacencies and VRFsrack: a front elevation per cabinetpower: the PDUs and what they feedidentity: who is in whatnetns: the stacks inside a machinesecurity: the zones and what may cross
- Filters: drawing less of the network
- Aggregation: one node per site, one line per bundle
- Icons
- Labelling and layout
- Stored arrangements
- Annotations: notes, areas and legends
- Interactive SVG: tooltips, links and ids
- Output formats
Layers: one inventory, twelve questions
One inventory, twelve questions. --layer picks which one the diagram answers.
| Layer | Nodes | Edges | Annotations | Reach for it when |
|---|---|---|---|---|
physical |
devices, adapters and patch panels | one per cable — every segment of a run, drawn separately | the same as l1 |
You are holding a patch lead. "Which position does this run occupy, and which are free?" |
l1 |
devices and adapters | one per cable, one per adapter attachment, one per tunnel; a run through a patch panel is one edge | medium, link rate, cable label, length; encapsulation on a tunnel | You are standing at the rack. "Which port is this patched into, and with what?" |
l2 |
the same | the same | VLAN membership per node and per link, port mode | "Is this host in VLAN 10 all the way to the gateway?" Broadcast domains, trunk pruning, a VLAN that stops one switch short. |
l3 |
the elements that hold a routable address, plus one node per IP prefix | one per address: element ↔ the subnet it is addressed in, labelled with the interface and the address | VLANs the prefix is reachable in | "Why can these two not reach each other?" The addressing plan, gateways, a subnet mask that is one bit off. |
ipam |
one node per prefix of the address plan — no hardware at all — clustered by routing instance | one per containment: the block ↔ what was carved out of it (dashed teal) | a utilisation bar, how many addresses are used of how many, how many are free, how many elements are in it, and the widest free blocks left | "Where does the next subnet go, and is anything nearly full?" The plan itself, rather than who is in it. |
overlay |
the elements that terminate a tunnel, plus one node per tunnel | one per endpoint, plus one per over — this tunnel runs inside that one |
encapsulation stack, VNI, MTU budget, what encrypts | "Is this traffic actually protected, and what carries it?" VPNs, VXLAN fabrics, a cleartext overlay somebody assumed was private. |
routing |
the elements that take part in routing — anything declaring routing, routes or vrfs — grouped into one cluster per VRF |
one per BGP session (solid, labelled with the AS pair) and one per OSPF adjacency (dotted, labelled with the area) | AS number, router id, area, the instances and static routes each device holds | "Who peers with whom, and in which table?" An iBGP mesh with a gap in it, an AS number typed twice, a VRF nothing is bound to. |
rack |
one node per rack named by a metadata.location |
none — a cable says nothing about where either end is bolted | a front elevation: one row per unit, occupied and empty alike, each occupant annotated with what it draws | "How much room is left in that cabinet, and what is above the UPS?" |
power |
the PDUs, plus every element the inventory records power for | one per feed: an outlet cord from a PDU (solid amber) and a poe feed from a PSE port (dashed) |
outlets used, load against capacity and the input_feed on a PDU; draw, redundancy and PoE budget on everything else |
"Is this rack fed from one strip, and is there capacity left?" A single-fed cabinet, an oversubscribed PoE budget, a box nobody wrote a power path for. |
identity |
one node per user and per group — no hardware whatsoever |
one per membership: the group ↔ what it holds, nested groups included | the account, the uid, the status and the key count on a user; the headcount and the gid on a group | "Who can get at this, and how did they get the access?" A group nobody emptied when somebody left, an account in nothing at all. |
security |
one node per security zone of every filtering device, framed by device — plus local and any where the policy names them |
one per zone pair the policy mentions, directed, labelled with the rules; green where the pair is open, red where it is closed, dashed amber where it is conditional | which interfaces are in each zone, every rule and translation of the pair, and whether the zone was declared at all | "What is this box actually allowed to let through?" A hole opened above the rule that closes the chain, a zone nothing is in, a policy nobody has read since it was written. |
netns |
one node per network stack: the element itself for a machine's initial namespace, plus one per declared spec.netns entry, framed by machine |
one per veth pair (solid cyan), one per nesting (dotted), and the cables, re-pointed at the stack holding the port they land on | the path of a nested namespace, the interfaces and addresses in each stack, the peer of every veth end | "What is inside this box?" A container host drawn as one node has hidden a dozen routing tables; this is the only view that opens it. |
The default is l1. -f html accepts --layer more than once and puts a
switcher over the results; every other format holds one layer, and asking for
two is a usage error rather than a silently discarded flag:
$ netviz -i examples/home-lab render --layer l1 --layer l2 -f svg
Usage: netviz render [OPTIONS]
Try 'netviz render --help' for help.

Error: --layer was given 2 times, but svg output holds one layer; render each one to its own file, or use a format that holds several (html)
physical and l1: the cabling record and the network
physical and l1 are the same graph drawn twice, and the difference between
them is the patch panels. A patchpanel
(docs/schema.md §15) is a passive cross-connect: a
run that goes switch → panel front → structured cabling → panel rear → server is
three cables in the inventory and one link on the network, because nothing
electrically can tell the panel is there. physical draws the cabling record
— the panels and every segment; every other layer splices each run into the
single edge it is, between the two active ports, carrying the sum of the segment
lengths and the rate of the slowest one. The result is exactly the graph the
same inventory would produce with the two devices cabled together directly,
which is what makes a panel free to model.
The splice is not a loss of information. -f json exports a
patch object naming the segments and the positions,
netviz path names the panels on the link line — as a
pass-through, never as a hop, because a panel takes no decision — and an SVG
tooltip lists the same record:
$ netviz -i examples/patch-room path sw-core-01 srv-app-01
...
   1  network/sw-core-01  [switch]
      out GigabitEthernet1/0/7
      ->  cable cbl-sw-pp07  (copper, 1Gbps, P-007A, 21m)  vlan 10  [via pp-r1-a front/7-rear/7, pp-r2-a rear/7-front/7]
   2  hosts/srv-app-01  [server]
      in  eno1                  10.10.0.11/24
l2: the same graph, annotated with VLANs
l1 and l2 are the same graph drawn twice: the same nodes and the same edges,
with VLAN membership printed on both and the port mode — access or trunk — on
the link. It is the layer to reach for when the question is about a broadcast
domain rather than about a cable.
l3: prefixes and who is addressed in them
l3 is a different graph: cables do not appear, because two devices are
adjacent at layer 3 when they share a prefix — not when a cable happens to run
between them (a route may cross three switches; a trunk carries VLANs neither end
routes).

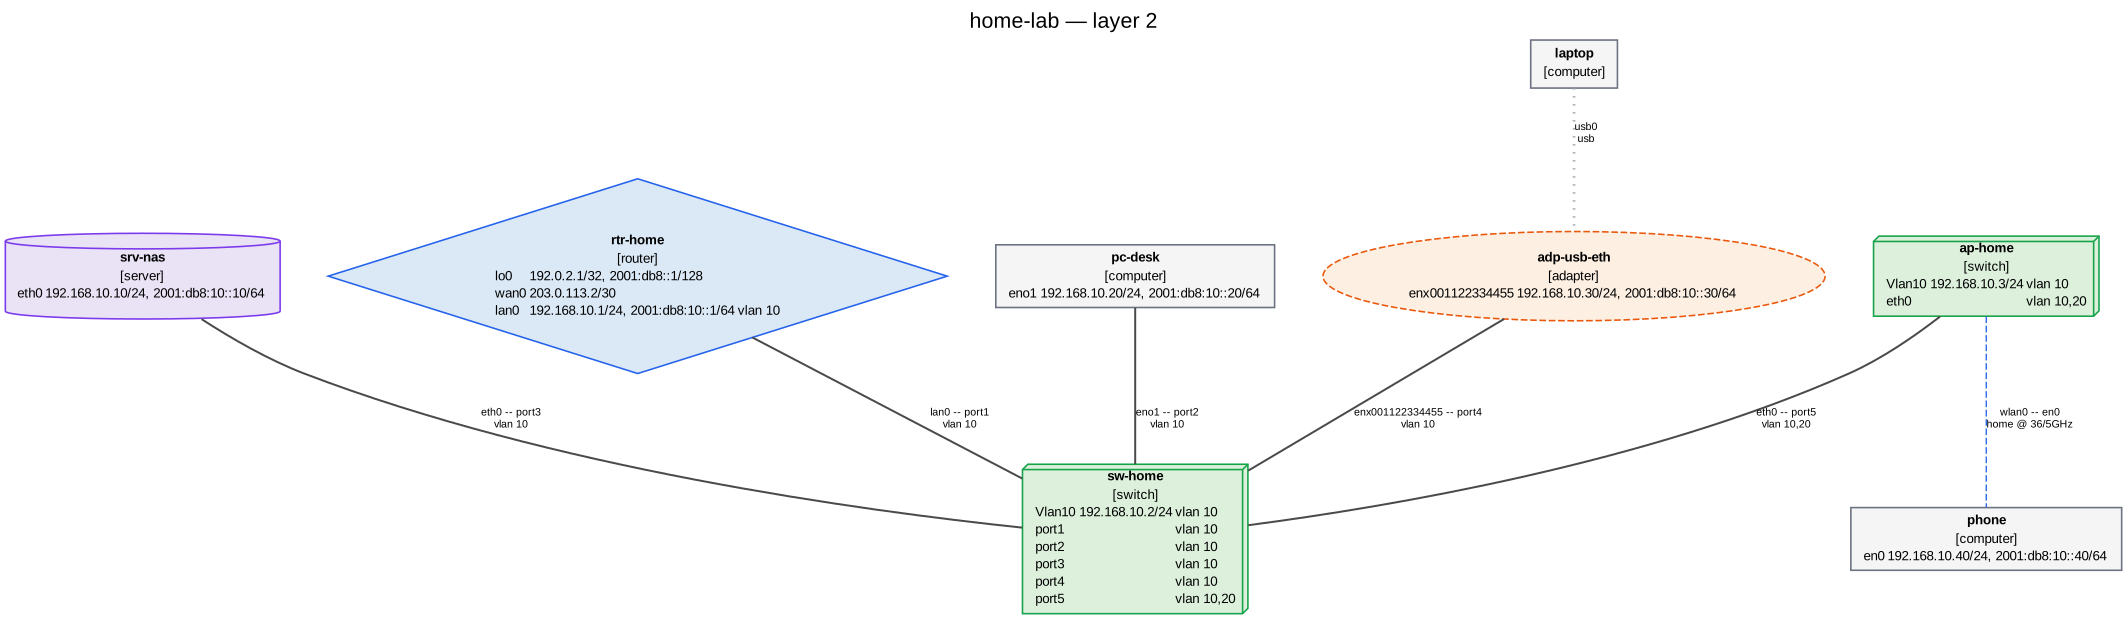
The same inventory as the diagram at the top of this page, at layer 3:
netviz -i examples/home-lab render --layer l3 --title "home-lab — layer 3" -f svg -o docs/images/home-lab-l3.svg.
The router's loopback and its ISP hand-off are prefixes of their own; the switch
and the access point appear only because their management SVIs hold an
address.
What layer 3 leaves out is deliberate:
- Elements with no routable address. A layer-2-only switch says nothing about IP reachability, so it is omitted rather than drawn floating beside the subnets it is not in. Give it a management SVI and it appears.
- Loopback and link-local addresses, and unnumbered interfaces.
127.0.0.1,::1andfe80::/10are scoped to one host or one link, so they are not prefixes of this network. - VLAN identity of a prefix. Grouping is by prefix, because that is what a
routing table keys on. A prefix deliberately re-used in two VLANs therefore
appears once — which is exactly what
W106points out. A VRF is the one thing that does split it: a routing instance is a routing table of its own, so10.0.0.0/24inblueand in the global table are two nodes, each labelled with its instance (docs/schema.md§16.1).
Two problems are visible only from the derived layers, and netviz validate
reports both:
| Rule | Fires when |
|---|---|
W105 |
Exactly one element is addressed in a prefix — a typo'd prefix length, or a neighbour nobody wrote down. Host routes and point-to-point prefixes are exempt. |
W106 |
Two elements claim the same address in one prefix from different VLANs, so the layer-3 view cannot tell which of them answers. |
netviz list subnets prints the same grouping as a table,
netviz ipam sizes it and reports what conflicts, and
render --layer l3 -f json exports it with a type discriminator on every node
(element or subnet) so a consumer can tell a derived prefix from a declared
device.
ipam: the address plan, and where the room is
ipam draws the same prefixes l3 derives and leaves the devices off. That
is the whole difference, and it is the point: a picture with the hosts on it
answers "who is in this subnet", which layer 3 already answers, and the hosts
bury the two things an address plan is opened for — how full each block is, and
where the next one goes.
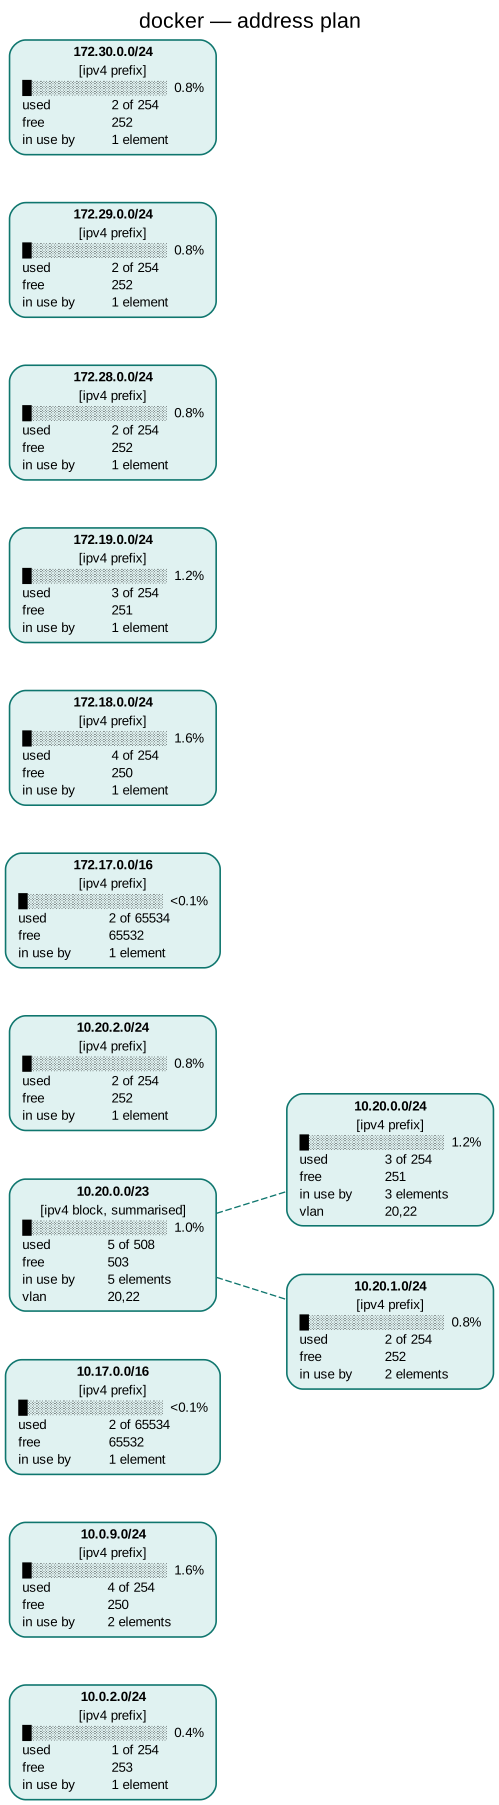
netviz -i examples/docker render --layer ipam --rankdir LR --title "docker — address plan" -f svg -o docs/images/ipam.svg.
Every box is one prefix; the dashed lines say which block it was carved out
of.
Each box carries what netviz ipam prints for that row — the same
numbers, derived once — plus the two facts a table has no column for:
- A utilisation bar, sixteen cells wide, above the counts. Across a page of
prefixes it is what the eye scans; the numbers under it are there because a bar
cannot tell 3 % from 5 % and an address plan is a document people do arithmetic
with. A prefix holding anything at all keeps at least one full cell, for the
same reason the percentage says
<0.1%rather than0.0%: two hosts in a/64is not an unused prefix. - The free blocks, widest first, on a block something is carved out of. The
three widest are named on the box and the rest are counted off; the tooltip
holds all of them. A leaf prefix names none — the gaps between three hosts in
a
/24are not blocks anybody hands out, and the free count above them is the answer.
Three kinds of box are drawn, and the subtitle says which:
| Subtitle | What it is |
|---|---|
[ipv4 prefix] |
A prefix something is addressed in, with nothing carved out of it. |
[ipv4 block, holds 3] |
A prefix something is addressed in that also contains three narrower prefixes of the plan — a router holding 10.0.0.1/16 over three /24s. |
[ipv4 block, summarised] |
A prefix nothing declares, drawn because the blocks below it fill it exactly: two /25s that between them are a /24 mean the plan holds a /24. This is aggregation, and it is the only box here no document writes down. |
Nothing else is invented. A /16 the inventory has one /24 of is not drawn
around that /24, because nobody allocated it; and two host routes are never
summarised into the /31 they happen to be adjacent in, because at that size the
supernet is an artefact of two addresses being next to each other rather than a
block anyone carved.
A VRF is an address space of its own (docs/schema.md
§16.1), so the prefixes of each routing
instance are framed in a box of their own and containment never crosses between
them: 10.0.0.0/24 in blue is not inside a 10.0.0.0/16 in the global table.
render --layer ipam -f json gives every box an ipam object — the utilisation
row, the parent, the children and the free blocks — beside the subnet object
layer 3 gives it, so a dashboard reads the plan without re-deriving it. The
editor offers the layer in its switcher like any other, -f html puts it behind
the same switcher as every other layer, and netviz report --layer ipam puts it
in an as-built document.
overlay: tunnels and what runs inside what
The overlay layer is a different graph again. Every tunnel becomes a node,
joined to each element it terminates on and to the tunnel it runs inside:
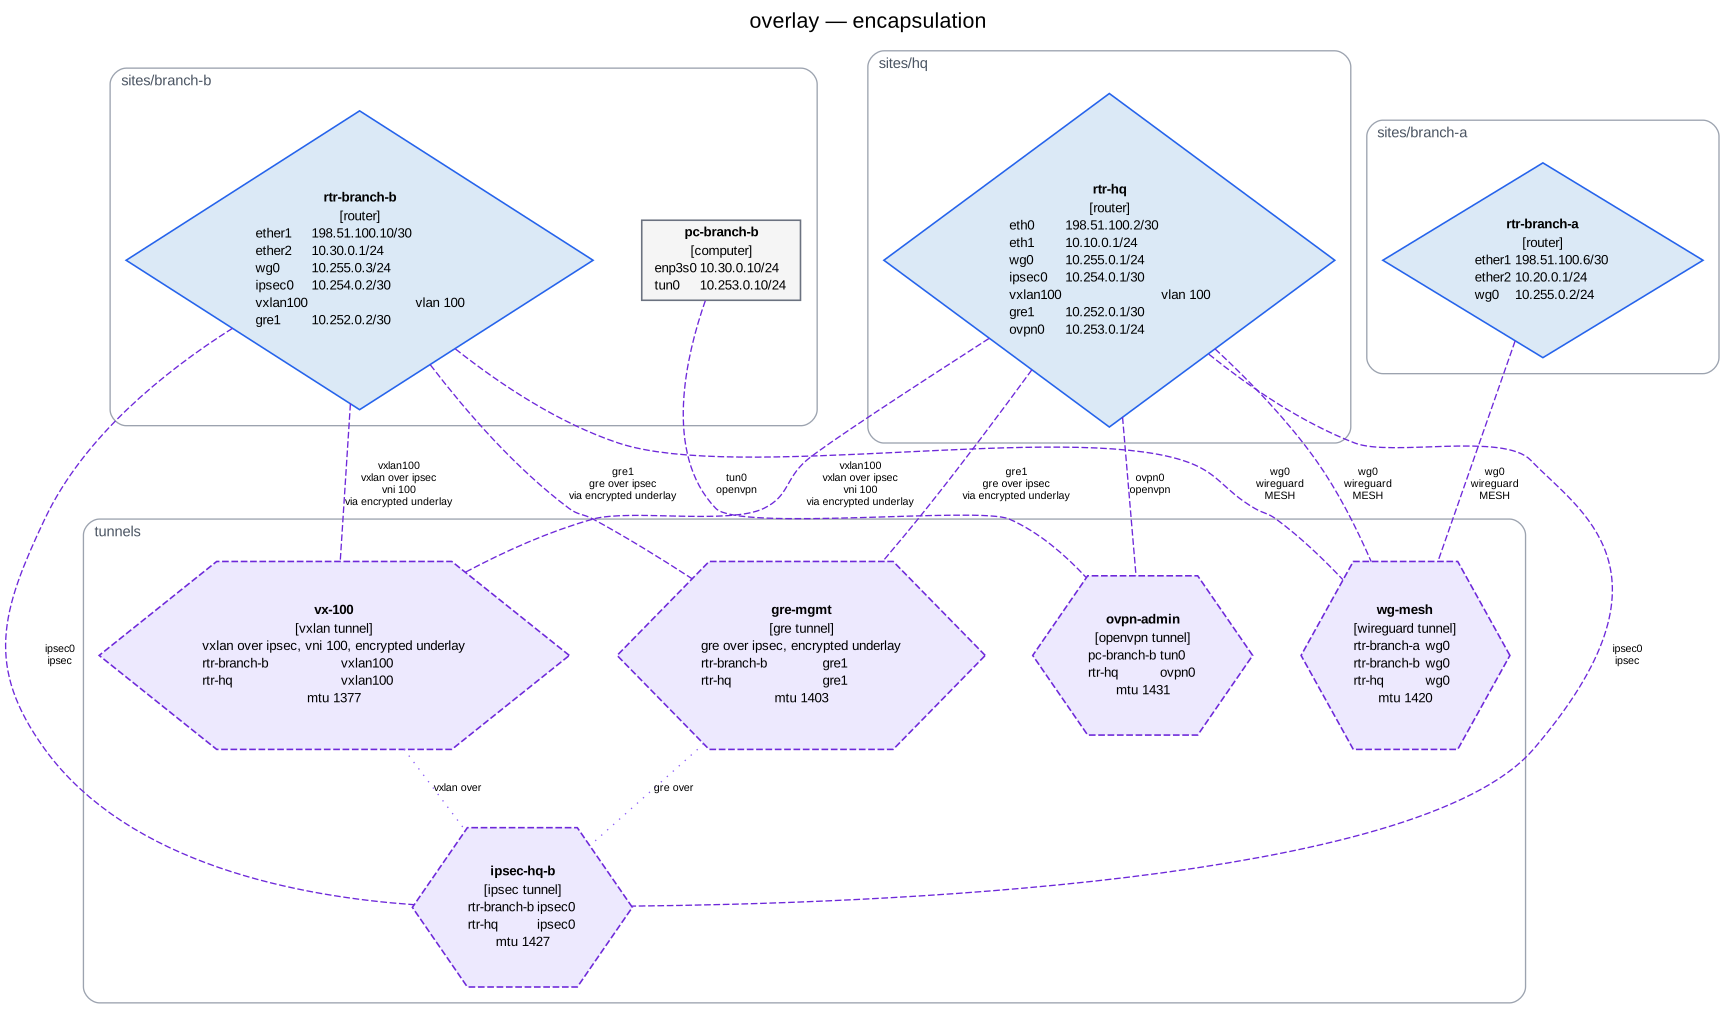
Produced from examples/overlay with
netviz -i examples/overlay render --layer overlay --group-by-namespace --title "overlay — encapsulation" -f svg -o docs/images/overlay.svg.
A tunnel has to become a node there because nesting is a relation between two
links, and a link cannot end on a link — which is why vxlan over ipsec is
undrawable at layer 1 and obvious here. Below that layer a point-to-point tunnel
stays a dashed edge, so a render shows the VPNs over the physical topology
without a box in the middle of each one.
routing: sessions, adjacencies and VRFs
The routing layer draws the control plane
(docs/schema.md §16.8). Nodes are the
elements that take part in routing at all, labelled with the AS number and router
id their peers know them by; edges are the sessions and adjacencies between them:
$ netviz -i examples/campus render --layer routing -f mermaid
n3(["rtr-north-core-01<br/>[router]<br/>AS 65001<br/>id 192.0.2.1<br/>…"])
…
n3 -- "iBGP 65001 · iBGP to rtr-south-core-01" --- n7
n3 -. "area 0.0.0.0" .- n4
The two kinds of edge are resolved differently, because the protocols work differently:
- a BGP session is declared, by address, on one or both ends. It is drawn
once however many times it is declared, solid, and labelled with the AS pair —
65001 → 65002for an external session,iBGP 65001when both ends are in one AS. A session whose address matches nothing in the inventory is reported as a dropped link rather than drawn to a node that does not exist, and asW135by the validator. - an OSPF adjacency is discovered, so netviz derives it the way the protocol does: two interfaces that run OSPF in the same area and are addressed in one subnet form one, drawn dotted and labelled with the area. Deriving it from the addressing rather than from the cables is what makes it right for two routers facing each other across a layer-2 switch, which no cable joins.
Clusters are VRFs, and they replace --group-by-namespace at this layer: the
grouping the reader asked for by choosing the layer wins over the one a flag
asks for. A router with interfaces in exactly one instance is drawn inside that
instance's box; one that straddles several belongs to no box — the same choice a
cross-site prefix gets at layer 3 — and names its instances on its label instead.
Policy-based routing is on the node, not on an edge
(§16.4). A rule decides
which table a packet is routed by, which is a fact about one router and not a
relationship between two, so there is nothing to draw a line between: the label
carries the rule count, and the tooltip and -f json carry the tables and the
rules themselves — in priority order, which is the order the device walks
them and the only order in which the list means anything.
Nothing physical appears. Two routers are adjacent here because they exchange routes, which a cable neither guarantees nor is needed for.
rack: a front elevation per cabinet
rack is not a topology at all. metadata.location
(docs/schema.md §3.2) records where an element
is bolted — site, room, rack, the lowest unit it occupies (position) and
how many it takes (height) — and --layer rack turns that into one front
elevation per cabinet, units on the vertical axis, empty ones drawn so the free
space is countable. Two things in the same unit are
E025, and
something that would stick out of the top is
E026.
Each occupied unit is annotated with the power the inventory records for
whatever is in it: a device shows its draw, and a PDU shows how full it is —
[server] 420 W, [pdu] 26.8% of 1840 W. That is deliberately in the same cell
as the kind rather than in a column of its own, because "can this cabinet take
another box" is one question asked of the two facts, and an elevation is already
three columns wide. Where the power comes from is
--layer power; what a unit costs is here.
Mermaid has no way to express a grid, so -f mermaid --layer rack is refused
with an error naming the formats that can:
$ netviz -i examples/patch-room render --layer rack -f mermaid
Usage: netviz render [OPTIONS]
Try 'netviz render --help' for help.

Error: --layer rack draws a front elevation — one row per rack unit, empty units included — and mermaid output has no way to express one; render it as dot, svg, html, png, pdf, json
power: the PDUs and what they feed
power is the distribution plant rather than the network
(docs/schema.md §17.5). It is the layer to reach
for when the question is electrical: which strip feeds this rack, how much is left
on it, and what stops working when one feed dies.
Nodes are the PDUs plus every element the inventory records power for — a
draw_watts, an inputs list, a poe_budget_watts, a powered_by: poe. A
pdu (§17.1) is a node with no
ports: an outlet is not an interface and no cable terminates on a strip, so a
PDU appears in no data layer at all and its node is built for this one, labelled
with how many outlets are in use, its load against its capacity, and its
input_feed. Everything else is the node it already is at layer 1 — the same
ports, labels and description — and only gains what it says about power.
Edges are the feeds, and the two kinds are drawn differently because they are found differently:
- an
outletfeed is drawn solid, in amber (#b45309) — a cord somebody can reach behind a rack and pull. It is declared by the load, one entry per power supply, and labelled with the outlet, the PSU and the watts that cord carries. - a
poefeed is drawn dashed, in a lighter amber (#ca8a04) — the power rides on a data run this diagram draws elsewhere, so it borrows the visual vocabulary a tunnel uses for "this runs over something else", in the power palette rather than the tunnel one. It is derived rather than declared, by walking the powered device's uplink to the PSE port at the far end (§17.4) — a walk that crosses patch panels, because a run through a panel is electrically one run for power exactly as it is for frames.
The line style is what carries the distinction, not the hue: a greyscale print of the diagram still tells a cord from a PoE run.
Everything else is discarded. A cable is not a power path — two servers joined by one patch lead may be on opposite sides of the room electrically — and the cords joining a PDU to what it feeds appear on no data diagram, which is the whole reason this layer exists.
Amber is the palette because it is the colour every electrical drawing uses for a
live conductor and the one no element kind had taken, so a power node cannot be
misread as part of the data path. pdu also has an icon in the bundled
themes.
Unlike rack, this layer is an ordinary topology — nodes joined by edges — so
every output format can draw it, Mermaid included:
$ netviz -i examples/patch-room render --layer power -f mermaid
flowchart TB
    n0["ap-ceiling-01<br/>[switch]<br/>22 W (max 25.5 W)<br/>powered over PoE"]
...
    n5["sw-access-01<br/>[switch]<br/>55 W (max 435 W)<br/>redundant, 2 feeds<br/>PoE 37/370 W"]
...
    n9["pdu-r2-a<br/>[pdu]<br/>3/8 outlets<br/>492.5/1840 W (26.8%)<br/>feed utility-a"]
...
    n9 -- "1 ↔ psu1 · 210 W" --- n2
...
    n5 -. "GigabitEthernet1/0/1 ↔ eth0 · 30 W" .- n0
...
sw-access-01 reads as both: a load of 55 W on two strips, and a source of 37 W
of the 370 W it may hand out. ap-ceiling-01 has no cord at all, and the dashed
line into it is the run it takes its traffic over.
identity: who is in what
identity is the one layer that draws no network
(docs/schema.md §19.3). Every other view
answers a question about equipment; this one answers "whose is it, and who may
touch it", which the cabling cannot answer at all.
Nodes are the user and group documents, and nothing else. An identity
owns no interfaces (§19.1), so it appears in no data layer
and its node is built for this one: a user is drawn as an oval — the shape every
organisation chart uses for a person — and a group as a folder, in a rose palette
no element kind had taken, so an identity view cannot be misread as a fragment of
a network one. Both have an icon in the bundled themes.
Edges are the memberships, one per entry of a group's spec.members, drawn
from the group to the member. That is the direction the fact is written in and
the direction a reader follows to answer "who is in this?". A nested group is an
ordinary member, so the hierarchy is drawn as one: everyone → engineering →
ana. A member that does not resolve is not drawn — NV-S010 is the place that
says so, and --force has to keep producing a picture.
Everything else is discarded, for the same reason the power view discards the cabling: a cable between two servers says nothing about who may log into either, and drawing both graphs at once produces a picture in which neither is readable.
$ netviz -i examples/home-lab render --layer identity -f mermaid
flowchart TB
    n0(("ana<br/>[user]<br/>Ana Brandt<br/>ana@example.invalid<br/>uid 1000<br/>1 ssh key"))
    n1(("kit<br/>[user]<br/>Kit Brandt<br/>kit@example.invalid<br/>uid 1001"))
    n2(("backup<br/>[user]<br/>uid 900<br/>service"))
    n3[\"admins<br/>[group]<br/>1 member<br/>gid 100"/]
    n4[\"household<br/>[group]<br/>2 members<br/>gid 101"/]

    n3 --- n0
    n4 --- n3
    n4 --- n1

    classDef group fill:#fbcfe8,stroke:#9d174d,stroke-width:2px
    classDef user fill:#fce7f3,stroke:#be185d,stroke-width:1px
    class n3,n4 group
    class n0,n1,n2 user
rendered 5 node(s) and 3 edge(s) as mermaid at layer identity
household holds admins, so ana is in it without being listed twice — which
is what the nesting is for, and what
netviz list groups puts a number on.
netns: the stacks inside a machine
netns is the one layer that draws below the device
(docs/schema.md §23.3). Every other view — this
one included, until you ask for it — treats a machine as one box, which is right
for a switch and wrong the moment the machine is a container host: a server
running twelve containers has twelve interface name spaces, twelve address
spaces and twelve routing tables, and a diagram with one node has drawn one of
them.
Nodes are the network stacks. The element node stays and stands for the
machine's initial namespace — it keeps its kind, its icon, its link to the
document and its place in a stored arrangement, because it is still the machine —
and every entry of spec.netns becomes a rounded cyan box beside it. All the
boxes of one machine are drawn inside a frame named after it, so what a reader
sees is "inside this host".
Edges say three different things:
- a veth pair (solid cyan) joins the two stacks its ends are in. That crossing is invisible at every other layer, because both ends are interfaces of one box;
- a nesting edge (dotted slate) runs from a namespace to the one created inside it. Nesting has no depth limit, and drawing it as an edge is what lets a four-deep hierarchy stay readable without four sets of nested frames;
- a cable is kept and re-pointed at the namespace holding the interface it lands on. That is the question the view exists for: how does the stack inside this container reach the wire?
A machine that declares no namespace and no veth pair is drawn only when something it is cabled to is opened up, and anything further away is dropped. It has one stack, which every other layer already draws; it is here so the wire has somewhere to arrive.
$ netviz -i examples/containers render --layer netns -o containers.svg
examples/docker is the same view at the scale a
container runtime produces it — sixteen stacks over three machines, nested three
deep — and the one to open if you want to see what the layer is for rather than
what it means.
security: the zones and what may cross
security is the one layer whose edges are decisions rather than paths
(docs/schema.md §24.5). Everywhere else a line
means "these two can reach each other". Here it means "and this is what is
allowed to cross".
Nodes are zones, not devices. spec.zones divides a device's interfaces
into regions (§24.1), and each becomes a pale red box
inside a frame named after the device that declares it. Two zones the inventory
never wrote are minted where the policy reaches for them: local, which is the
machine itself — the traffic that terminates on it rather than crossing it — and
any, which stands for a rule that left a zone unset. The tooltip and the JSON
both carry declared: false for those two, because a reader who thinks any is
a zone somebody configured has misread the whole picture.
Edges are zone pairs, and they are directed. Policy is asymmetric: lan to wan is a different statement from wan to lan, and a diagram that drew them as one line would have merged the one distinction a firewall exists to make. The label is the rules themselves up to three of them, and a count past that; the whole chain is on the tooltip and in the JSON, in the order the device walks it.
Colour is the verdict, and there are three:
- green, solid — every terminal rule of the pair accepts. Traffic crosses.
- red, solid — every one denies. Nothing does.
- amber, dashed — conditional: the pair holds both kinds, or holds nothing terminal at all (everything in it marks or logs, and the decision is further down the chain). This is the case worth opening the tooltip for, and the dash is what says so in a greyscale print.
None of the topology survives, and none of it should. A cable between two hosts says nothing about whether the firewall between them lets anything through, and the diagram somebody needs in order to argue about policy is one whose boxes are the zones.
The filters below reach a zone through the device it is on, since nothing
here stands for the box itself: --name fw-edge draws that firewall's zones and
nothing else, and --kind firewall draws the zones of every appliance while
leaving a router's behind.
$ netviz -i examples/campus render --layer security -o policy.svg
Filters: drawing less of the network
Filters narrow what is drawn. Values within one option are alternatives;
different options are combined with AND, so --namespace sites/north --kind switch keeps the switches of that site only. An unset filter selects
everything, and filtering never changes what the remaining nodes say about
themselves.
| Option | Repeatable | Keeps |
|---|---|---|
--namespace NS |
yes | Elements in NS or in any namespace below it. |
--vlan VID |
yes | Elements participating in that VLAN (1–4094). A host on an untagged access port counts as a member. |
--kind KIND |
yes | Elements of that kind: switch, router, firewall, hub, computer, server, adapter, patchpanel, pdu, user, group. A cable is an edge and so is a tunnel, so neither is selectable; both follow whichever elements survive. |
--name GLOB |
yes | Elements whose short or fully-qualified name matches the shell-style glob. |
--neighbors-of NAME |
no | Only the neighbourhood of one element. An unknown name is a usage error, with suggestions. |
--depth N |
no | How many hops --neighbors-of reaches. Default 1. |
--select QUERY |
no | Elements a selector query matches. |
--select is the general case, and the six options above are sugar for it —
each denotes a query, and netviz query --explain with the flags prints which:
| Flag | Query |
|---|---|
--namespace NS |
namespace under NS |
--vlan V |
vlan = V |
--kind K |
kind = K |
--name G |
name ~ G |
--neighbors-of N --depth D |
within D hops of (fqn = N or name = N) |
The flags are not going anywhere: they are shorter for what they do, they
complete in a shell, and they are in every runbook anybody has written. But they
cannot say "every access switch with no uplink", and --select can:
$ netviz -i examples/campus render --select 'label.role = access and label.site = north' -f mermaid --no-annotations
flowchart TB
    n0["sw-north-acc-01<br/>[switch]<br/>10.1.99.11/24<br/>vlans: 1,10,20,30,99"]
    n1["sw-north-acc-02<br/>[switch]<br/>10.1.99.12/24<br/>vlans: 1,10,20,30,99"]
    n2["sw-north-acc-03<br/>[switch]<br/>10.1.99.13/24<br/>vlans: 1,10,20,30,99"]

    classDef switch fill:#dcf0dc,stroke:#16a34a,stroke-width:1px
    class n0,n1,n2 switch
rendered 3 node(s) and 0 edge(s) as mermaid at layer l1
A query and the flags are combined with AND, exactly as two flags are. The same
expression narrows watch, show, list, export and report, and is what
netviz query answers and the editor's search box takes —
docs/query.md is the grammar, the attribute vocabulary and a
cookbook.
At --layer l3 every filter still selects elements; the subnet nodes are
derived, so each one survives exactly as long as one selected element is still
addressed in it, and it then reports only those members. --kind router draws
the routers and the prefixes they route, never an empty prefix. --neighbors-of
counts a subnet as a hop, so depth 1 from a device reaches the prefixes it is
addressed in and depth 2 the other devices in them. --group-by-namespace
leaves subnets outside every group: a prefix spanning two sites belongs to
neither.
$ netviz -i examples/home-lab render --neighbors-of sw-home --depth 1 --kind switch --kind server -f mermaid
flowchart TB
    n0[("srv-nas<br/>[server]<br/>192.168.10.10/24<br/>2001:db8:10::10/64<br/>vlans: 10")]
    n1["sw-home<br/>[switch]<br/>192.168.10.2/24<br/>vlans: 10,20"]
    n2["ap-home<br/>[switch]<br/>192.168.10.3/24<br/>vlans: 10,20"]

    n0 -- "eth0 ↔ port3 · H-003 · 1Gbps" --- n1
    n2 -- "eth0 ↔ port5 · H-005 · 1Gbps" --- n1

    classDef server fill:#eae2f5,stroke:#7c3aed,stroke-width:1px
    classDef switch fill:#dcf0dc,stroke:#16a34a,stroke-width:1px
    class n0 server
    class n1,n2 switch
rendered 3 node(s) and 2 edge(s) as mermaid at layer l1
Aggregation: one node per site, one line per bundle
Every filter above removes detail by removing elements. Past a few hundred
devices that is the wrong question: you do not want less of the network, you
want all of it in less space. Two options summarise instead of narrowing, and
both run before the renderers, so dot, svg, mermaid, json and html
all get the same answer.
| Option | Repeatable | Draws |
|---|---|---|
--collapse NS |
yes | One node for NS and everything under it, labelled with the namespace, its element count per kind, and the VLANs and prefixes it participates in. |
--collapse-depth N |
no | The same, for every namespace N levels deep. |
--bundle-links / --no-bundle-links |
no | Fold every set of parallel links into one edge / fold none. Unset folds declared link aggregations only. |
--collapse-depth 1 is the site-level overview of a large tree in one flag:
netviz -i examples/campus render --collapse-depth 1 --group-by-namespace \
  --title "campus — one node per site" -f svg -o campus-collapsed.svg
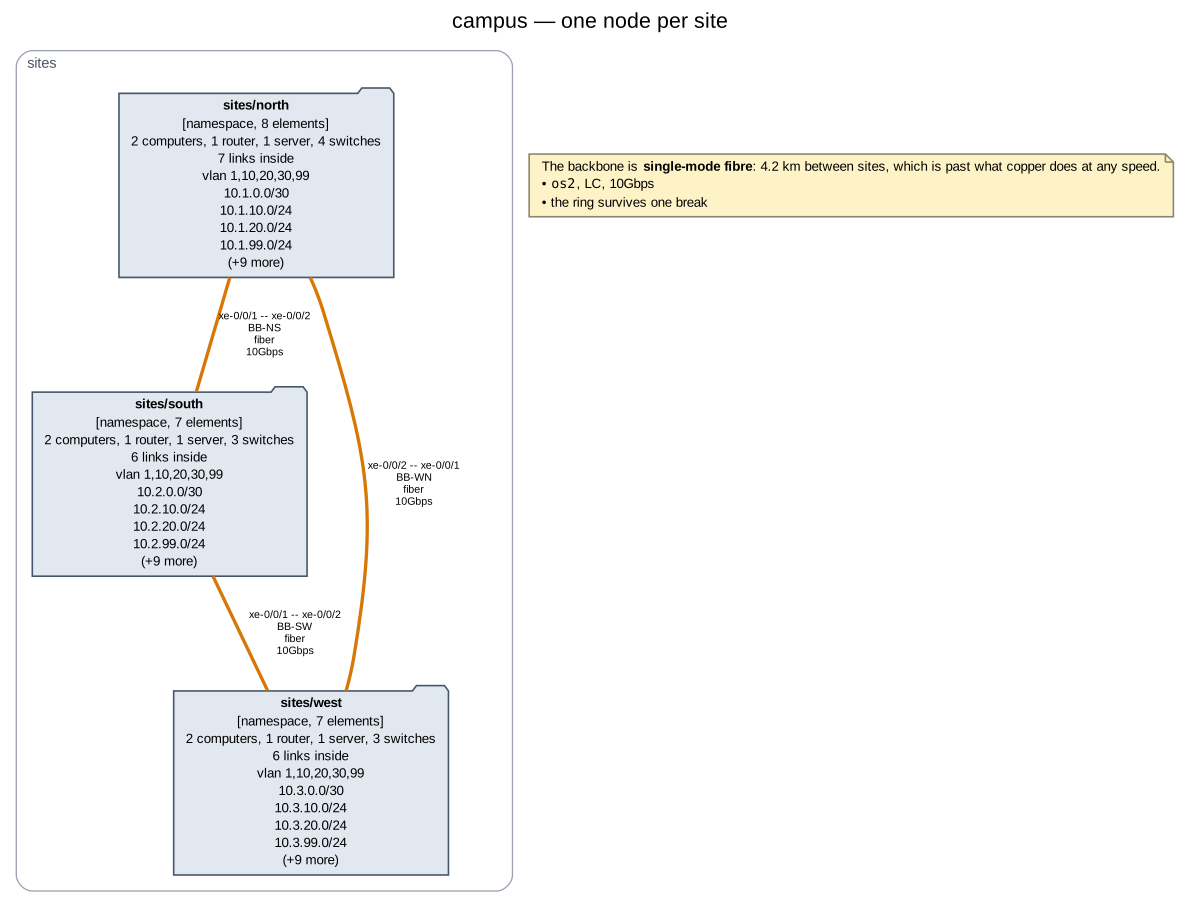
Depth is counted from the shallowest namespace that actually branches. Every
element of examples/campus lives under sites/, so that directory is not a
level a reader distinguishes — nothing is outside it — and depth 1 means one
node per site rather than one node for the campus. Depth 2 would be one node per
tier inside each site.
$ netviz -i examples/campus render --collapse-depth 1 -f mermaid
flowchart TB
    n0[/"sites/north<br/>[namespace]<br/>8 elements: 2 computers, 1 router, 1 server, 4 switches<br/>7 links inside<br/>vlans: 1,10,20,30,99<br/>10.1.0.0/30<br/>10.1.10.0/24<br/>10.1.20.0/24<br/>10.1.99.0/24<br/>(+9 more)"\]
...
rendered 3 node(s) and 3 edge(s) as mermaid at layer l1
Nothing is thrown away, only folded:
- Links crossing a boundary keep their identity and attach to the collapsed node — the three backbone fibres above are the same three cables, with the same labels and the same rates.
- Links inside one are counted on the label (
7 links inside) rather than drawn, and named in full in the tooltip and in-f json. - The collapsed node takes a tooltip and an
--element-idsid exactly as a real node does, so a collapsed diagram is as deep-linkable as any other. -f jsonmarks it"type": "aggregate"and gives it anaggregateobject listing every element it stands for, so a consumer can never mistake one box for one device:
$ netviz -i examples/campus render --collapse-depth 1 -f json |
    jq '.nodes[0].aggregate | {namespace, elementCount, countsByKind}'
{
  "namespace": "sites/north",
  "elementCount": 8,
  "countsByKind": { "computer": 2, "router": 1, "server": 1, "switch": 4 }
}
Link bundling solves the other half. Four cables in a LAG, or three cables
and a tunnel, draw as a band of parallel lines that Graphviz stacks into noise;
a bundle draws one edge, labelled with the count, weighted by it so the layout
pulls the endpoints together, and carrying every member in its tooltip and in
-f json.
LAG members are bundled by default, because the inventory has already said they are one logical link — a switch declaring
- name: Port-channel1
  type: lag
  members: [GigabitEthernet1/0/1, GigabitEthernet1/0/2,
            GigabitEthernet1/0/3, GigabitEthernet1/0/4]
draws one edge labelled Port-channel1 -- Port-channel1 / lag, 4 members / 4Gbps, the sum of what the members carry. Nothing is guessed: two spare
cross-links running alongside that LAG stay two edges, and two distinct
port-channels between one pair of switches stay two bundles. --bundle-links
goes further and folds every set of parallel links, whatever the reason they are
parallel — a judgement about legibility rather than a claim about the
configuration, so it is opt-in and the resulting edge is not called a LAG.
--no-bundle-links draws every cable, which is what a cabling document wants.
netviz render --collapse-depth 1 -f svg -o overview.svg      # sites only
netviz render --collapse sites/north --collapse sites/south  # two of three
netviz render --collapse-depth 1 --bundle-links -f svg       # one line per pair
netviz render --no-bundle-links -f dot -o cabling.dot        # every cable
Filters and aggregation compose, in that order: the filter decides what exists,
the collapse folds what is left, so --kind switch --collapse-depth 1 gives one
box per site holding that site's switches and nothing else.
Icons
By default a node is a Graphviz shape — a diamond for a router, a 3-D box for a
switch — which keeps a diagram readable with nothing installed. --icons swaps
the shape for a picture:
netviz render --icons cisco --layer l2 -f svg -o topology.svg
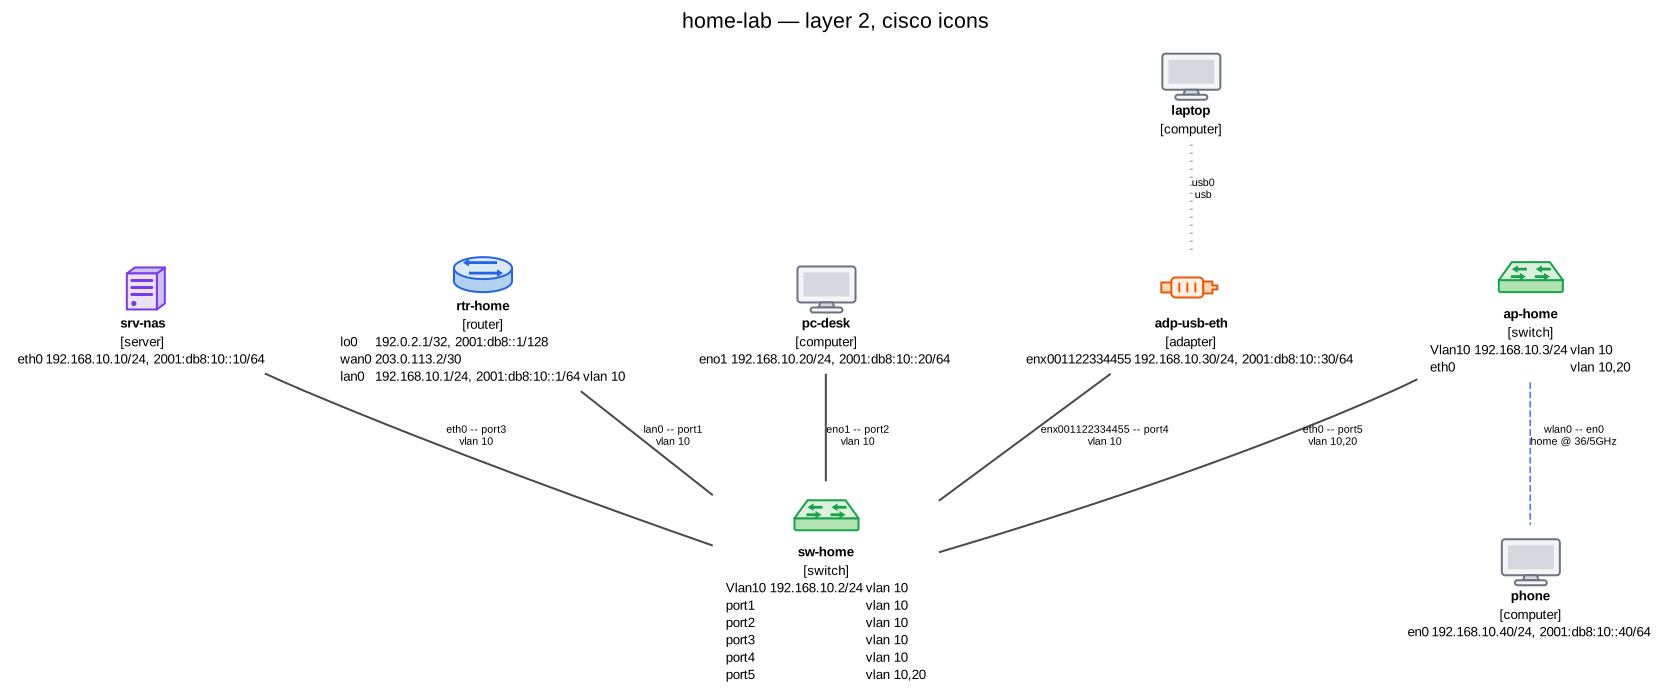
netviz -i examples/home-lab render --layer l2 --icons cisco --title "home-lab — layer 2, cisco icons" -f svg -o docs/images/home-lab-icons.svg.
Only how a node is drawn changes. The labels, the addresses, the VLANs, the edges and every filter behave exactly as they do without a theme, and a kind the theme has no picture for keeps its plain shape rather than disappearing.
cisco ships with netviz and covers every kind that becomes a node: the
eight hardware kinds — pdu included, so --layer power
draws strips rather than boxes — the subnet clouds of --layer l3, and the tunnel
conduit of --layer overlay. The artwork is drawn in the topology idiom Cisco made the
industry convention and is netviz's own, under the same MIT licence as the
rest of the package — Cisco's published icon library is copyrighted and is not
redistributed here.
The tunnel glyph is a conduit: a bore with a payload going in one end and
coming out the other. There is one for every tunnel type, because encapsulation
is what they have in common and the type is on the label anyway, and it says
nothing at all about confidentiality — a lock would put netviz's guess about a
security property into a picture, and a reader who did not recognise the glyph
would read its absence as "nothing to say". That stays a colour and a word: a
cleartext tunnel is drawn crimson and labelled cleartext, and
W127 says so
in prose. A collapsed namespace gets no icon either — it is not a thing with a
picture but a box holding several, and the folder shape says that better.
A directory works just as well, which is how you use that library, or any
other set, if you have it. A theme is nothing but a directory of images named
after the kinds they stand for — router, switch, hub, computer,
server, adapter, patchpanel, pdu, user, group, subnet and tunnel,
with an .svg,
.png, .jpg or .gif extension:
ls my-icons/          # router.png  switch.png  server.png
netviz render --icons ./my-icons -f svg -o topology.svg
Files for kinds you do not cover are simply absent; those nodes keep their plain
shape, so a set of three icons is a usable theme. --icons none turns a theme
back off, for a wrapper script that always passes the option. When the theme is
named in netviz.toml, a relative
directory resolves against the configuration file rather than the working
directory, so a colleague who runs netviz from a parent folder gets the same
icons.
Two details are worth knowing:
- SVG output is self-contained. Graphviz references an icon by path; netviz
embeds the file into the SVG it hands back, so the diagram still draws in a
README, an email or the
watchpreview. pngandpdfwant raster icons. Graphviz reads an SVG image only when it was built against librsvg, and those two outputs go through cairo. The bundled theme therefore ships each icon as both an SVG and a PNG and picks per format. A theme of your own that holds only SVGs still rendersdotandsvg; ifpngfails, netviz says exactly that rather than drawing a diagram with holes in it.
--icons is ignored, with a warning, by -f mermaid and -f json: neither has
a picture to put an icon in.
In the editor it is a switch, not a flag.
netviz web has an icons box in its header:
tick it and the diagram redraws as pictures, untick it and the shapes come back,
without restarting the server. --icons still chooses which theme — a
directory is named on the command line and never by a browser — and now also
says where the switch starts.
src/netviz/render/iconsets/README.md
documents the bundled themes from the other side — the naming rule, why each
kind is present twice, and how to regenerate a PNG after editing its SVG.
Icons decide what a node is a picture of; a style decides everything else
about how it is drawn. --icons is one rung of a ladder: an element may carry
its own spec.style — a fill, an outline, a shape, a label colour, an icon of
its own — and --theme NAME|PATH applies a stylesheet that says the same things
about a whole class of elements at once, selected by kind, name, namespace,
role or label. Two themes ship, blueprint and mono; --no-style renders
from the built-in palette alone, which is how to read a topology whose
stylesheet is in the way. docs/styling.md is the guide, and
docs/schema.md §22 the
specification.
Labelling and layout
These options change what a node says and where the diagram puts it. None of them changes which elements are in it.
| Option | Default | Effect |
|---|---|---|
--title TEXT |
none | Caption for the diagram. |
--show-ips / --no-show-ips |
on | Print configured IP addresses on the nodes. |
--show-vlans / --no-show-vlans |
on | Annotate nodes and links with VLAN membership. |
--max-addresses N |
4 |
Longest address list spelled out under a node before it is abbreviated to "and N more". 0 prints the count alone. |
--group-by-namespace |
off | Draw each namespace as a visual group (a Graphviz cluster, a Mermaid subgraph). |
--rankdir TB|LR|BT|RL |
TB |
Layout direction. A wide network reads better left to right, a deep one top to bottom. Honoured by the Graphviz backends and by mermaid. |
--element-ids |
off | Give every node, edge and namespace a stable id derived from its name — see Interactive SVG. |
--show-ips and --show-vlans reach further than the labels: they also control
the hover text of an SVG, the per-interface detail of
-f json, and what an
HTML page is even allowed to hold. "Do not print
the addresses" has to mean all of the printing.
Stored arrangements
By default the layout is Graphviz's decision, taken afresh on every render. That is the right default — a diagram nobody has arranged should still be readable — but it means the diagram cannot be arranged: move a node and the next render moves it back.
netviz layout turns the arrangement into data. It runs
the automatic layout once and stores the coordinates as a kind: layout
document (docs/schema.md §18); from
then on the arrangement is the source of truth, and render honours it with no
flag of its own — it is a fact about the inventory, not an option of the drawing.
netviz layout --write          # store the arrangement of the l1 view
netviz render -f svg           # ... and it comes back exactly
What "honours it" means depends on how much is stored, per view:
| Stored | What the renderer does |
|---|---|
| nothing | lays the graph out from scratch, exactly as before |
| some of the nodes | pins those and lets the engine place the rest around them, then separates whatever still overlaps |
| every node | runs the layout engine in no-op mode (neato -n2), so the drawing is the arrangement, point for point |
A partial arrangement costs two Graphviz runs per render — one to place what is
unplaced, one to draw the completed result — because a single pinned run returns the whole
drawing scaled onto Graphviz's own canvas, which would move the nodes you placed by hand.
That is the transient state while an arrangement is being built; a fixed view is one run,
and so is an auto one. netviz layout --write closes the gap.
All four backends agree, by construction. svg, png and pdf are the same
Graphviz run; html embeds that SVG; and json publishes the same coordinates
in the same units. The arrangement lives on the graph rather than in the render
options, so no backend has to be told about it and none can be told something
different.
json adds a layout object per node (position, and size when one is
stored), a layout object per edge (below), and a top-level layout carrying
the mode, the units, the effective routing and the group boxes — enough for a
browser to draw the graph itself without running Graphviz.
Namespace frames in a fixed layout are drawn by netviz. neato does not
draw clusters, so when the whole view is arranged the frames come from the stored
group boxes instead of from the engine — which is more faithful, not less: the
frame is where you put it. The caption sits centred above its frame rather than
inside it at the left, which is the one visible difference between an arranged
diagram and an automatic one; docs/follow-ups.md §17 records
why (in short: a caption inside the box touches whatever is near the top of it,
and neato answers two touching nodes by dropping spline routing for the whole
graph).
A mermaid render ignores an arrangement entirely. Mermaid does its own layout
in the browser and has nowhere to put a coordinate.
Links are geometry too
Where the nodes go is half of an arrangement. The other half is the cables:
which way the trunk goes round the diagram rather than through it, whether it
turns at right angles, and where its label sits. All three live in the same
kind: layout document, under spec.views.<view>.edges, keyed by the link's
address (docs/schema.md §18).
Waypoints are the bends, and only the bends. edges.<address>.waypoints is
the list of points a link is routed through, and they are interior points:
the two ends of a route are always the nodes themselves. That is what makes a
hand-routed cable worth placing — drag a device and it carries its cables along
rather than stranding them, and the bends somebody chose stay where they were
put.
netviz layout --write --waypoints seeds them, which gives a route to drag
rather than a decision to keep, and it also records the size of every node a
stored route leaves from. Those sizes are not decoration: a route netviz
computes has to stop at the shape it runs into, and netviz cannot measure a
label. Without them the route is clipped against a default box — Graphviz's own
0.75 × 0.5 inch node — so it may stop short of the shape, and the render says
so.
In netviz web the same thing is a gesture. Click a link
to select it; double-click the line to drop a bend where you clicked; drag a
bend to move it; drag the hollow midpoint handle to insert a bend and place
it in one motion; right-click a bend to remove it. From the keyboard, b
adds a bend, Shift-B straightens the link — every bend cleared, the routing
style and the label kept — and r sets the routing style. Each is one
set-link-geometry operation through the same comment-preserving write path as
every other edit (docs/editing.md), so a bend
dropped in the browser is a hunk in a YAML file you can read.
Three routing styles, and the most specific one wins. spline is the curve
Graphviz draws — what every diagram looked like before this existed, and still
the default; orthogonal is right angles, the way a patch schedule is drawn;
straight is segment to segment. Each can be set at three levels:
| Where | Applies to |
|---|---|
spec.views.<view>.edges.<address>.routing |
one link |
spec.views.<view>.routing |
every link of one view |
spec.routing |
every link of every view |
A link that pins a style of its own beats the view, which beats the inventory.
--routing on render, watch and
diff, and routing in the [render] table of
netviz.toml, set a default — so
they change what unpinned links do and leave a link that has decided for itself
alone. netviz layout --write --routing STYLE records the view's default in
the document.
How much of that a render can deliver depends on how much of the view is arranged, because the two paths to Graphviz are not equally expressive:
- For a fully arranged view netviz computes each route itself — from the
node positions, the stored bends and the style — and writes it into the
Graphviz
posattribute. That is the only way a per-link style can be expressed at all: Graphviz has a graph-widesplinesand nothing per edge. - For a view Graphviz is laying out, only that graph-wide attribute is
available (
true,ortho,line), so the default reaches the drawing and nothing else can.
Rather than emit something broken, netviz says what it could not honour. Each advisory is phrased as the thing that fixes it, and each is advisory rather than fatal — a diagram that is nearly right is worth drawing, and a warning that stops a render is a warning nobody leaves turned on:
| When | What it says |
|---|---|
| bends are pinned but the view is not fully placed | Graphviz has to route the whole diagram and the bends are lost; netviz layout --write places the rest |
| links pin a style the engine-laid-out drawing cannot give them | they are drawn in the graph-wide style like everything else, until the arrangement is pinned |
| the drawing is orthogonal, Graphviz is laying it out, and the links are labelled | Graphviz will not put a real edge label on an orthogonal route it routed itself, so the labels become xlabels floated near their links |
A label is pinned to the link, not to the canvas.
edges.<address>.label is {at: 0.5, offset: {x: 0, y: 0}}: at is how far
along the route the annotation sits, from 0 at the source end to 1 at the
target, and offset nudges it off the line in points. Storing it on the link
rather than as a coordinate is what makes it survive both endpoints being
dragged somewhere else, which is the whole reason a label gets nudged in the
first place — to keep it clear of whatever crosses underneath.
It reaches the DOT as an lp attribute. lp is normally something Graphviz
writes — where it decided to put the label — but the no-op engine reads one
back in, which is the one place a label position can be pinned at all. So it
applies to -f dot, to -f svg, png and pdf, and to -f html, all of
which go through Graphviz, and it is published by -f json. A label left half
way along with no offset emits nothing: that is where a renderer puts one nobody
has moved, and a number in a file that can only go stale is worse than no
number.
Parallel links are fanned apart, and a self-link is a ring. Two cables between the same pair of devices land on exactly the same line once both ends are pinned — Graphviz's own nudging is part of its routing, and a fixed drawing does none of it. So netviz fans them itself, 14 points between neighbours, centred: a lone link is not moved at all, and an odd-numbered bundle keeps one cable on the direct line between the two devices, which is the one a reader traces first. Each member ends up with a line of its own to hover, to select and to drop a bend on.
A bundle folded by --bundle-links
counts once rather than once per member: folding four cables into one trunk is
done so that the reader sees one line, and fanning the fold against itself would
undo it. And a self-link — a cable whose two ends are on one device — is
drawn as a loop standing off the node, with the fan deciding how far off, so
four VLANs terminating on one switch are four rings rather than one thick one.
-f json publishes both halves of this per edge, because a consumer wants both.
Under layout, waypoints, routing and label are what the inventory
pinned — the decisions somebody made, which is what an editor round-trips —
while route (the polyline), controls (the same line as cubic Bézier control
points) and drawnAs (the style it came out in) are the line netviz actually
drew. The second group appears only for a fully arranged drawing, because
anywhere else Graphviz decides it and the export does not know the answer.
Routing around things
An orthogonal link runs at right angles between the points it is pinned
through. Left at that it will happily run across a switch it is not connected
to, which is the single most visible thing wrong with a hand-arranged diagram —
and for a while it was exactly what netviz did
(docs/follow-ups.md §19). It no longer does. For a fully
arranged, orthogonal drawing, netviz routes each link around the boxes it
is not attached to.
Three promises, and they are what make this safe to have on by default:
- A bend you placed is never moved. Routing fills the segments between pinned waypoints; a waypoint itself is a decision, and it is left alone even when the route ends up running straight through it.
- A link that already keeps clear is left exactly where it was, to the last decimal place. Avoidance is a repair, not a redraw, so a clean diagram renders byte-identically to the way it did before this existed. "Clear" means clear by the clearance, not merely not-quite-touching: a cable drawn two points from a switch reads as a cable on the switch, and moving it is the repair.
- Nothing is written to your files. A computed route is recomputed on every
render. It is published beside the authored bends — as
layout.routedin-f json, and to the editor canvas — but it stays computed until you say otherwise. Innetviz web,Shift-R(Pin the computed route) writes it into the layout document as waypoints, at which point it is an authored route like any other: handles on every bend, never recomputed.
How it decides. Every placed node is grown by a clearance and becomes an
obstacle; so does a free-standing kind: area and a placed kind: note. (An
area that names members is not: it is a zone drawn behind the devices it
encloses, and treating it as solid would make every cable that terminates inside
it unroutable — its members are obstacles instead, which is the same thing said
correctly.) The corners and centre-lines of those rectangles form a grid, and an
A* search over it finds the cheapest route, where the cost is length plus a
penalty per turn, per crossing of a line already drawn, and per channel already
occupied. That last pair is what turns three cables between one pair of switches
into three parallel lanes past the obstacle rather than three separate detours
that fan out and re-converge.
What it costs. The grid is built once per render and shared by every link — on a thousand-device diagram it is not rebuilt a thousand times — and a link whose line is already clear never searches at all, which is most links in most diagrams. A search is bounded by a window around the link's two ends rather than by the size of the drawing, so a short cable costs the same on a large diagram as on a small one.
Where it stops, it says so. Three cut-offs — a window with too many grid points to search, a search that has taken too many steps, and a link with no clear route at all (two devices drawn on top of each other, a corridor narrower than the clearance) — each make the link fall back to the local Z or L and each are reported rather than silently applied. The diagram is never worse than it was before, and you are told which link and why.
--no-avoid, or avoid = false in the [render] table of
netviz.toml, turns the whole thing
off and gives back the local rule: faster, entirely predictable, and the right
answer for a deliberately schematic drawing. tools/route_crossings.py prints
the number of crossings in any inventory with and without it, which is how the
claim above is checked rather than admired.
A worked example: an orthogonal, waypointed diagram
tests/fixtures/routed is the home-lab example
arranged and routed. Both the arrangement and the DOT it produces are
committed, and tests/test_golden.py renders the one and compares it against
the other on every CI run — so the example below cannot go stale without a test
going red.
The whole of its link geometry is eight lines, on top of a spec.routing that
makes the diagram orthogonal
(tests/fixtures/routed/layout.yaml,
with the node positions elided):
spec:
  routing: orthogonal
  views:
    l1:
      nodes:
        routers/rtr-home:
          position: {x: 474, y: 271}
          size: {width: 464, height: 146}
        switches/sw-home:
          position: {x: 847, y: 56}
          size: {width: 169, height: 112}
        # ... and the other six
      edges:
        # A trunk dragged clear of the router, then labelled off the line so the
        # two cables running under it stay readable.
        cables/cbl-rtr-sw:
          waypoints:
            - {x: 640, y: 380}
            - {x: 900, y: 380}
          label: {at: 0.3, offset: {x: 0, y: 14}}
        # One link that disagrees with the view: a radio association is not a
        # cable and reads better as the straight line it physically is.
        cables/wl-ap-phone:
          routing: straight
Every node is placed, so the view is fixed, so netviz routes the links
itself. netviz -i tests/fixtures/routed render -f dot produces
tests/fixtures/golden/routed-l1-orthogonal.dot,
of which these are the two interesting edges, with the colours and the tooltips
elided:
$ netviz -i tests/fixtures/routed render -f dot
...
  "routers/rtr-home" -- "switches/sw-home" [..., pos="640,345 640,356.67 640,368.33 640,380 726.67,380 813.33,380 900,380 920.5,380 941,380 961.5,380 961.5,272 961.5,164 961.5,56 951.83,56 942.17,56 932.5,56", lp="817.85,394", label="lan0 -- port1\nH-001\n1Gbps\nvlan 10", ...];
...
  "wireless/ap-home" -- "hosts/phone" [..., pos="1485,240 1485,186.83 1485,133.67 1485,80.5", label="wlan0 -- en0\nwireless", ...];
The trunk. Its spine is the router's centre, the two pinned bends, and the
switch's centre. orthogonal breaks each leg into an L, turning along that
leg's own dominant axis first — locally decided, so dragging one bend cannot
re-shape the leg on the far side of the route. Then both ends are clipped
against the boxes the arrangement recorded, a point clear of each: the router is
146 points tall and centred at y: 271, so the route starts at 640,345 above
it rather than inside it, and the switch is 112 tall and centred at y: 56, so
it stops at 932.5,56.
The leg after the second bend is where obstacle
avoidance shows: pc-desk sits between 900,380 and
the switch, and the L that leg would otherwise take runs straight across it. So
the route carries on east to 961.5 — a clearance clear of the desk's right
edge — before turning down. Both pinned bends are still in the polyline, and the
first two legs are the same points they were before anything was routed: what
avoidance filled in is the segment between the last bend somebody placed and the
switch. What is left is 640,345 → 640,380 → 900,380 → 961.5,380 → 961.5,56 → 932.5,56 — the six corners visible in the pos, each straight leg written as a
cubic whose control points are its own thirds, which is the 3n + 1 form a
Graphviz pos is.
The lp is the label. at: 0.3 is 30 % of the way along the route by arc
length, which lands on the horizontal leg at 817.85,380, and offset: {x: 0, y: 14} lifts it to 817.85,394. Note that it moved when the route did — that
is the point of pinning a label to the link rather than to the canvas. None of
the other links carries an lp, because none of them has been moved.
The radio association. routing: straight on that one link beats
spec.routing: orthogonal, so it is drawn as a single clipped segment from
1485,240 to 1485,80.5 — one cubic, four control points. Left to the view it
would have been the orthogonal Z every link with no bends of its own gets here,
which for two vertically aligned nodes puts a corner half way down and makes the
same visible line out of two cubics. That is the difference a per-link style
makes, and
expressing it is exactly why a fully arranged drawing carries a computed pos
instead of a graph-wide splines.
Annotations: notes, areas and legends
An arrangement says where the network is drawn. An annotation says something
about the drawing: a callout explaining why one link is orange, a dashed box
round the DMZ, a key for the colours. Those are the three sidecar kinds of
docs/schema.md §21,
and like a stored arrangement they are a fact about the inventory rather than an
option of the render — every backend draws whatever the view declares, with no
flag to turn on.
What they never do is change the picture's content. An annotation adds no node
and no edge at any layer, so a diagram with three of them holds exactly what the
same diagram without them holds. A filter narrows what they say rather than what
they mean: an area is drawn round the members this drawing actually kept, an
area left with nothing to enclose is dropped rather than drawn as an empty
frame, and a note whose anchor was filtered away keeps its text and loses its
leader line. A --vlan 20 diagram must not gain a dashed box round nothing.
Where the backends differ is vocabulary, because a zone, a callout and a key ask for constructs that a DOT document, a Mermaid flowchart, a JSON object and an mxGraph file have to very different degrees:
| Format | area |
note |
legend |
|---|---|---|---|
dot, svg, png, pdf, html |
a cluster under an automatic layout; a filled rectangle in the _background with a caption node under a stored arrangement |
a shape=note node, with a dotted leader to what it is about |
a cluster holding one table of swatches; the corner is exact only in a stored arrangement |
mermaid |
a subgraph, and its label only |
an ordinary node, plus a dotted link when it is anchored | not drawn, and said so in a comment |
json |
annotations.areas |
annotations.notes |
annotations.legends |
drawio |
a container rectangle behind the nodes |
draw.io's own shape=note |
a frame of swatch rows |
The last row is not a -f of render: it is
netviz export drawio, listed here because it is the fourth
vocabulary the same three kinds have to be said in.
What is not per backend is the resolution behind them. Which members survive a filter, what a generated legend says and how the markdown subset of §21.1 parses are decided once, for all four, so a note reads the same in an SVG, in a Mermaid block, in the JSON and in the editor.
Graphviz: a cluster, a background rectangle, and where a key lands
An area is a cluster when Graphviz is laying the graph out. A node can be drawn inside at most one box — that is all a DOT document can express — so the three things that want to box one are put in an order:
- an explicit
kind: areathat names the node. It is the most specific thing anybody wrote down about this diagram, and the only one of the three somebody stated on purpose; - between two areas that both name it, the one declared first. Declaration order is the only tie-break that does not depend on the graph, so the same inventory always draws the same picture;
- whatever is left: the layer's own clustering — the VRF boxes of the
routingview — and then--group-by-namespace. Each loses the nodes an area took, and is omitted entirely when it has none left.
An area with an explicit rectangle but no drawn members is not a cluster under an automatic layout: there is nothing to put in it, and Graphviz has nowhere to put a rectangle that is not around something.
In a fixed arrangement it is a background rectangle instead, exactly as a
namespace frame is and for the same reason: neato -n2 draws no clusters, so
netviz draws the zone itself, into the graph's _background. The rectangle is
spec.geometry when the area pins one and otherwise the box enclosing wherever
the members were actually drawn, grown by the area's padding — which is the
whole difference between naming members and pinning a box: the first follows the
devices when the arrangement moves them.
The caption is not in the background. It is an ordinary plaintext node with
a pos, because a T operation inside a _background segfaults Graphviz
2.43 — the version Debian 12 and Ubuntu 22.04/24.04 ship — and does it
conditionally, so a diagram would render for months and crash the week a device
was deleted. docs/follow-ups.md §17 has the measurement and
the variants that were tried; the short version is that only the polygon
operations survive, so text is never put there, for an area's label any more
than for a namespace's.
A note is a node. shape=note is the shape Graphviz has for exactly this,
and making it a real node means it is laid out with the graph rather than
floated over it, and can be hovered, linked and deep-linked like anything else.
Its leader is an edge with constraint=false, which is the attribute that
matters: a callout must not be able to move what it is commenting on. In a fixed
arrangement a note uses its own pinned position, or is placed beside its anchor
when it has none of its own; a note that has neither — its anchor is on another
layer, or a filter removed it — is the one case an arranged drawing leaves out,
because a missing pos reads to the no-op engine as the origin and puts the
callout on top of whatever the arrangement left in the corner.
A legend is a cluster holding one plaintext table, so the key gets a frame
and a grid of swatches without netviz measuring any text. The title goes
inside the table rather than on the cluster, because a fixed drawing has no
cluster to put it on and a caption that vanished from the arranged diagram would
be a caption that vanished from the drawing somebody had taken most care over.
A legend's corner is honoured when the drawing has a stored arrangement (§18):
the key is placed just outside the bounding box of everything else, on the side
the corner names. Under an automatic layout Graphviz decides where it goes,
and it will generally set the key beside the drawing rather than in the corner
asked for. Nothing in Graphviz pins a cluster to a corner, and the tricks that
come close — a rank constraint, an invisible edge — move the key by distorting
the topology, which is a worse trade than a key in the wrong corner. Run
netviz layout --write to pin the arrangement, after which the corner is
exact.
Mermaid: what it cannot say, said in the source
Mermaid has no vocabulary for most of §21, so the three kinds are drawn as
closely as a flowchart allows and every gap is stated in the output rather than
left for a reader to notice. An area with members becomes a subgraph,
which is Mermaid's only container: it keeps the area's label and loses its
colour, its border style and its padding, because a Mermaid subgraph has no
style of its own. An area that is a rectangle of canvas rather than a set of
elements has nothing to become — Mermaid places nothing — and is dropped. A
note becomes an ordinary node with a note-like classDef and, when it is
anchored, a dotted link to what it is about; Mermaid has no note shape and no
free-floating text, so it is a box among the boxes, and the emphasis of §21.1 is
flattened to its text. A legend is not expressible at all: there is no
construct for a keyed table that is not part of the graph. Everything dropped is
named in a %% comment at the foot of the diagram — invisible in the rendered
picture, plain in the source, which is the right side of that trade: the reader
of the diagram cannot act on the limitation, and the reader of the document
is usually the person wondering where their legend went.
The foot of a -f mermaid render of an annotated inventory, with the topology
elided:
    subgraph area0["DMZ"]
        direction TB
        n0["sw-core<br/>[switch]<br/>10.0.0.1/24"]
        n1[("srv-proxy<br/>[server]<br/>10.0.0.2/24")]
    end
    note0["Orange links are fibre. The run to the annexe is 180 m, which is past what copper does."]
    ...
    note0 -.- n0

    classDef netvizNote fill:#fef3c7,stroke:#8b856d,stroke-width:1px,stroke-dasharray:3 2
    class note0 netvizNote
%% areas are drawn as subgraphs: their colour, border style and padding are not expressible in mermaid
%% legend 'key' (3 entries) is not drawn: mermaid has no construct for a key that is not part of the graph
The note is a box among the boxes and its **Orange** is gone; the area kept
its caption and lost the #fee2e2 it asked for; the key is two comments and no
table.
The JSON export and the HTML page
-f json carries a top-level annotations object with
notes, areas and legends, present only when the view declares any — a
document from an inventory with no annotations in it is unchanged, byte for
byte, by this feature existing.
Each entry is the resolved annotation rather than a copy of the document. An
area's members are already narrowed to what this drawing holds, so a consumer
never gets a reference the nodes array does not contain. A note carries both
its text and the parsed blocks and spans, so a client draws the same paragraphs,
bullets and emphasis without owning a markdown implementation of its own — and
without two implementations drifting apart. A generated legend carries the
swatches it generated, not the auto: layers that asked for them: auto is an
instruction, and an instruction is not something a consumer of a drawing
should have to execute.
-f html needs no separate story for the picture:
a note, an area and a legend are drawn by Graphviz, so they arrive in the
embedded SVG like everything else, with the same --element-ids ids the JSON
publishes. Each layer of the page also carries that identical annotations
object beside its records, so a panel showing what a note says, or which
elements an area encloses, has the data without a second request and without
parsing the markdown subset again in the browser.
draw.io: shapes that survive a round trip
netviz export drawio is the one format that is edited and
handed back, so an annotation has to arrive there as what it is rather than
as a picture of it: a note is draw.io's own shape=note with an HTML label, an
area is a container rectangle behind the nodes, and a legend is a frame
holding a swatch and a caption per row. None of the three is an image, a group
of paths or a text blob — which is the whole difference between a diagram
somebody can edit and one they can only look at. A stakeholder retypes a note in
place, drags the DMZ and carries the DMZ, and corrects a colour with a click.
Because the cells are native they survive the round trip. Every one carries the
same identity block a device cell carries, so netviz import drawio
reconciles a dragged note by the machinery that reconciles a dragged switch: a
move comes back as spec.geometry on the note's own document, a retyped label
as its spec.text, a deleted cell as the annotation being deleted. A generated
legend is the deliberate exception — it carries identity so that it can be
recognised and ignored, because writing back a key that was derived from the
drawing would be writing back the drawing.
Placement happens in netviz's coordinates before the page frame is computed, so a note pinned above the topmost switch and a legend outside its corner enlarge the page instead of being clipped at the margin. Areas are written before the nodes, because z-order in mxGraph is document order and a zone written after its members would cover them.
Turning them off
Two scopes, and they answer different questions. spec.views on the annotation
decides which drawings it belongs to — empty means every one of them, which is
what a remark about a site wants, while views: [l3] is for a remark that only
makes sense once the picture is prefixes rather than cables. That one is per
annotation and lives in the inventory.
The other is per render: RenderOptions.annotations, the display option every
backend consults. It is on by default, because an annotation is something
somebody wrote down about this diagram and leaving it out has to be asked for.
Turned off, no backend emits any of them and the output is byte-identical to the
same inventory with no annotation documents in it — which is what makes it a
display option and not a filter. It is a rendering-pipeline option today rather
than a flag on netviz render, so the way to draw the
network without its commentary from the command line is to render an inventory
that does not carry it.
Interactive SVG: tooltips, links and ids
An SVG is the artefact that gets committed to a repository or dropped into a wiki, and it can carry more than the picture. Three attributes travel with it, none of which changes the drawing:
netviz render -f svg --element-ids \
    --link-template 'https://git.example.com/net/blob/main/{file}#L{line}' \
    -o docs/topology.svg
| Flag | Honoured by | Ignored by | What it does |
|---|---|---|---|
--tooltips (default on) |
svg, dot, html |
png, pdf, mermaid, json |
Hover text on every node, edge and namespace box. |
--link-template URL |
svg, dot, html |
png, pdf, mermaid, json |
Turns each element into a link to the document that declares it. |
--element-ids |
svg, dot, html |
png, pdf, mermaid, json |
A stable id on every node, edge and cluster. Always on in html, which is built on the other two. |
-f dot writes the attributes because a DOT file is the input to somebody
else's dot; -f svg is where they reach a reader. png and pdf are
pictures and drop them silently — netviz warns when you asked for one of the
three and picked a format that cannot carry it. mermaid and json have
interaction models of their own and ignore all three.
Tooltips are the same per-element records netviz web
shows in its info boxes, rendered as plain text — one builder, so a committed
diagram and the live preview cannot disagree. Hovering the switch of the
quickstart inventory gives:
sw-office [switch]
namespace: devices
labels: site=office
vlans: 10
interfaces (2):
  port1  ethernet  vlan 10 (access)
  port2  ethernet  vlan 10 (access)
links (2):
  port1 — devices/rtr-gw:lan0  (cable, copper, 1Gbps)  vlan 10
  port2 — devices/pc-alice:eno1  (cable, copper, 1Gbps)  vlan 10
Every port, including the two the label had no room to annotate, and both cables — with the far end, its interface, the medium, the rate and the VLAN.
They work in any browser with no JavaScript: netviz puts the text in the SVG
<title> element of each shape, which is the construct browsers have popped up
since SVG 1.1. The text is bounded — long lists are counted off ((+12 more))
and the whole is clipped — so a tooltip never covers the diagram it explains.
--no-show-ips and --no-show-vlans apply to the hover text as well as to the
labels: "do not print the addresses" has to mean all of the printing.
--no-tooltips removes the detail entirely, for a diagram published somewhere
it should carry nothing the picture does not show.
--link-template is a format string expanded per element. Five
placeholders, and an unknown one is a usage error before the inventory is even
loaded, rather than four hundred broken links in a committed file:
| Placeholder | Expands to |
|---|---|
{file} |
Path of the declaring document, relative to the inventory root — switches/sw-office.yaml. |
{line} |
1-based line the document starts on. |
{name} |
Fully-qualified name — sites/hq/sw-core. |
{namespace} |
Namespace alone — sites/hq, empty at the root. |
{kind} |
switch, router, cable, tunnel, … |
Every substituted value is percent-encoded (/ excepted, since a path is
hierarchical), so nothing an inventory contains can escape the URL. A cable
links to the line of the document that declares it, an adapter attachment to the
adapter, a tunnel to the tunnel document. A layer-3 prefix node links nowhere:
no file says 192.168.10.0/24, and a link that 404s is worse than a shape that
is not clickable. So does any element whose line the parser could not report,
when the template asks for {line}.
--element-ids derives an id from the fully-qualified name, so it survives
someone adding a device to the file above it:
sites/hq/sw-core   →  id="node-sites_hq_sw-core"
sites/hq/cbl-07    →  id="edge-sites_hq_cbl-07"
sites/hq           →  id="cluster-sites_hq"
Anything outside [A-Za-z0-9_.-] becomes an underscore, because an XML id
may not hold a / and because the ids of a published diagram are a second,
unescaped copy of the inventory's names. Two names that reduce to the same slug
get -2, -3 suffixes in graph order. That makes a diagram addressable from
outside:
<a href="topology.svg#node-sites_hq_sw-core">the core switch</a>

<style>
  #node-sites_hq_sw-core polygon { stroke: #dc2626; stroke-width: 3; }
</style>
One quirk worth knowing: Graphviz XML-escapes - as - when it writes an
id, so grep id=\"node-sites_hq_sw-core\" over the raw file finds nothing.
Every XML parser, browser and stylesheet sees the id unescaped; only a text
search does not.
Output formats
-f/--format decides what the artefact is. svg, html, png and pdf need
Graphviz on the PATH; dot, mermaid and json do not.
| Format | Needs Graphviz | Reach for it when |
|---|---|---|
dot |
no | You want the Graphviz source, to post-process it, to feed somebody else's dot, or to diff it. The default. |
svg |
yes | The diagram is going into a repository, a wiki or an email. Scales, carries tooltips, links and ids, and embeds its icons. |
html |
yes | The diagram is for somebody else — one self-contained page that pans, zooms and searches. See below. |
png |
yes | Something downstream only takes a raster image. Carries no interactivity. |
pdf |
yes | It is going to be printed or attached to a document. |
mermaid |
no | It is going into Markdown that GitHub or GitLab renders in place. |
json |
no | A program is the reader. See below. |
png and pdf are binary, so -o/--output is required for them when stdout is
a terminal. -o creates parent directories.
When dot is installed but not on PATH
The usual state of Graphviz on Windows — neither the installer nor
choco install graphviz reliably adds bin to PATH — and a common one on
macOS, where a process started outside a login shell does not inherit
/opt/homebrew/bin. netviz therefore looks in three places, most explicit
first:
NETVIZ_DOT, if set, is taken as the full path to the binary.PATH, which resolvesdot.exeon Windows anddotelsewhere.- The default install locations for the platform —
C:\Program Files\Graphviz\bin,/opt/homebrew/bin,/usr/local/bin,/opt/local/bin,/usr/bin.
So step 3 usually means it works with no configuration at all. When it does not,
set the variable rather than editing PATH:
export NETVIZ_DOT=/opt/homebrew/bin/dot # macOS
$env:NETVIZ_DOT = 'C:\Program Files\Graphviz\bin\dot.exe' # Windows
Nothing is cached, so installing Graphviz while netviz watch is running is
enough — the next re-render finds it. And when it genuinely is not there, the
error names the install command for your platform and says what to do
instead; it is never a FileNotFoundError traceback.
$ netviz -i examples/quickstart render -f mermaid
flowchart TB
    n0[/"pc-alice<br/>[computer]<br/>192.168.10.20/24<br/>vlans: 10"/]
    n1(["rtr-gw<br/>[router]<br/>203.0.113.2/30<br/>192.168.10.1/24<br/>vlans: 10"])
    n2["sw-office<br/>[switch]<br/>vlans: 10"]

    n1 -- "lan0 ↔ port1 · 1Gbps" --- n2
    n0 -- "eno1 ↔ port2 · 1Gbps" --- n2

    classDef computer fill:#f5f5f5,stroke:#6b7280,stroke-width:1px
    classDef router fill:#dbe9f6,stroke:#2563eb,stroke-width:1px
    classDef switch fill:#dcf0dc,stroke:#16a34a,stroke-width:1px
    class n0 computer
    class n1 router
    class n2 switch
rendered 3 node(s) and 2 edge(s) as mermaid at layer l1
Mermaid's renderer refuses a diagram of more than 500 edges, and that ceiling is
a secure config a document is not allowed to raise for itself — so GitHub,
GitLab and mmdc will not draw one, however valid it is. netviz warns when it
crosses the line and names the filters that would bring it back down; -f dot
and -f svg have no such limit.
The interactive HTML page
-f html writes one file that pans, zooms, searches and explains itself,
with nothing to install and nothing to fetch:
netviz render -f html --layer l1 --layer l2 --layer l3 \
    --title "home-lab — every layer" -o docs/home-lab.html
docs/home-lab.html is that command's output, committed:
the home-lab inventory at all three layers, 177 kB, no server. GitHub shows an
.html file as source, so download it — or open it from a Pages site — to see
the page itself.
It is the format to reach for when the diagram is for somebody else: attach it
to a change request, commit it next to the YAML, publish it to GitHub Pages, or
open it from a file:// URL on a machine that has never heard of Python. What
you get:
- pan and zoom — drag or arrow keys, scroll or
+/−, pinch on a touch screen;for Fit puts the whole diagram back in the window and Reset returns the page to how it opened; - search — type a name, an address, a MAC or a VLAN and the matches light up
while the rest dims, with a result list you can walk by keyboard (
/focuses the box,Escclears it); - a detail panel — click an element for its full resolved configuration:
every interface, its addresses and VLANs, its MTU and MAC, every cable and
tunnel that lands on it, and where it sits in an encapsulation stack. These
are the same records
-f jsonexports andnetviz webshows, rendered by the same code; - toggles — the addresses and the VLAN annotations off and on, and a namespace to focus while the rest of the network dims;
- a layer switcher, when you passed
--layermore than once; - deep links — selecting an element puts its id in the URL fragment, and
opening that URL selects it again. The ids are the
--element-idsones, sotopology.html#node-sites_hq_sw-coreandtopology.svg#node-sites_hq_sw-corename the same switch.
Self-contained is meant literally. The page makes no network requests of any
kind — no CDN, no web font, no stylesheet, no analytics, no image URL. The style
sheet and the client are hand-written vanilla CSS and JavaScript that ship
inside the package and are inlined at render time; there is no bundler, and
netviz gained no runtime dependency for any of it. The only URLs a page can
hold are the ones --link-template was asked for, and those are links a reader
clicks rather than resources the page loads.
The page enforces that on itself: it carries a strict
Content-Security-Policy in a <meta>, built from the SHA-256 of each inline
block, so it needs neither 'unsafe-inline' nor 'unsafe-eval' and a page that
grew a fetch would be refused by the browser rather than quietly making one.
Everything an inventory wrote reaches the page as text — the escaping battery
covers a </script> in a description and in a --title.
Two consequences of there being no layout engine in a browser are worth knowing:
- A toggle switches drawings, it does not re-flow one. Graphviz decided
where every shape goes, so the page embeds one properly laid out drawing per
view — each layer, with and without the addresses and the VLANs — and shows
the one you asked for. Identical drawings are stored once, so an inventory
with no VLANs pays nothing for the VLAN toggle. That is also the size: expect
roughly 43 kB of client plus a drawing per view, or ~177 kB for the
three-layer example above. A view costs its drawing and essentially nothing
else — the records are stored once for the whole page however many layers
draw an element, and an
--iconstheme is stored once however many nodes and views use it, so turning icons on usually makes a page smaller rather than larger.tools/bench_html.pyis the harness those numbers come from. --no-show-ipsand--no-show-vlansare a ceiling, not a starting state. Turning one off means the page holds no drawing that prints it and no record that carries it, so a published page cannot be talked into giving up an address by editing its JSON. Leaving it on means the page opens with it and can turn it off.
--tooltips is honoured as the hover card the page draws from those records;
--no-tooltips leaves clicking as the way in. --icons, --group-by-namespace
and every filter behave exactly as they do for -f svg, because it is the
-f svg pipeline underneath.
netviz watch with -f html -o topology.html keeps the
file current while you edit, and --serve shows the page itself in the preview.
The JSON export
-f json is the machine-readable face of a rendering: the resolved topology,
so a consumer gets name resolution, VLAN derivation and adapter attachment
without reimplementing any of it. Every reference is a fully-qualified name and
every collection is ordered deterministically, so two runs over the same
inventory produce byte-identical output and git diff on a committed export is
meaningful.
{
  "apiVersion": "netviz.dev/v1alpha1",
  "kind": "NetworkGraph",
  "layer": "l1",
  "nodes": [
    {
      "id": "hosts/pc-desk", "type": "element", "name": "pc-desk",
      "kind": "computer", "namespace": "hosts", "vlans": [10],
      "interfaces": [
        {"name": "eth0", "type": "ethernetCsmacd", "mac": "…",
         "addresses": ["192.168.10.20/24"], "vlan": {"mode": "access", "vlans": [10]}}
      ]
    }
  ],
  "edges": [
    {
      "id": "cables/cbl-pc", "kind": "cable",
      "endpoints": [{"node": "hosts/pc-desk", "interface": "eth0"},
                    {"node": "switches/sw-home", "interface": "port2"}],
      "medium": "copper", "speed": 1000000000, "speedText": "1Gbps", "vlans": [10]
    }
  ]
}
The apiVersion/kind pair is the schema version: within one apiVersion
keys are only ever added, never renamed or removed, and an absent optional key
means not configured rather than unknown. title appears only when
--title was given, and dangling only under --force, so an export that is
missing links says so rather than implying they do not exist. Node id is what
every edge endpoint refers to; an endpoint's interface is absent when the edge
attaches to an element rather than to one of its ports. A node's type
distinguishes a declared element from a derived one — a subnet at
--layer l3, a tunnel at --layer overlay, an aggregate under --collapse
— and each adds an object of that name. An aggregate node's object carries the
full list of elements it stands for, and a bundled edge carries a bundle
object holding every link folded into it, exported by the same code that exports
an unbundled one: a summary is machine-readable as a summary, never as a device
or as a cable.
--show-ips and --show-vlans control the per-interface detail, exactly as
they control what a diagram prints; node and link VLAN membership is always
exported, because it is topology rather than decoration.
For the other machine-readable artefacts an inventory can produce — a CSV cable
schedule, a power load schedule, a DNS zone, an SVG rack elevation — see
netviz export.
See also
netviz render— the command reference: synopsis, every flag, exit codes.docs/styling.md—spec.styleand--theme: the colour and shape vocabulary, the selectors, and which rule wins when two of them disagree.netviz.toml— give any of these options a default, and collect variations into named profiles.netviz watchandnetviz web— the same pipeline, redrawn on every save.netviz path --highlight— one traced route drawn over the topology it crosses.docs/ci.md— the same render as a GitHub Action, and the reusable workflow that publishes the page on every push.